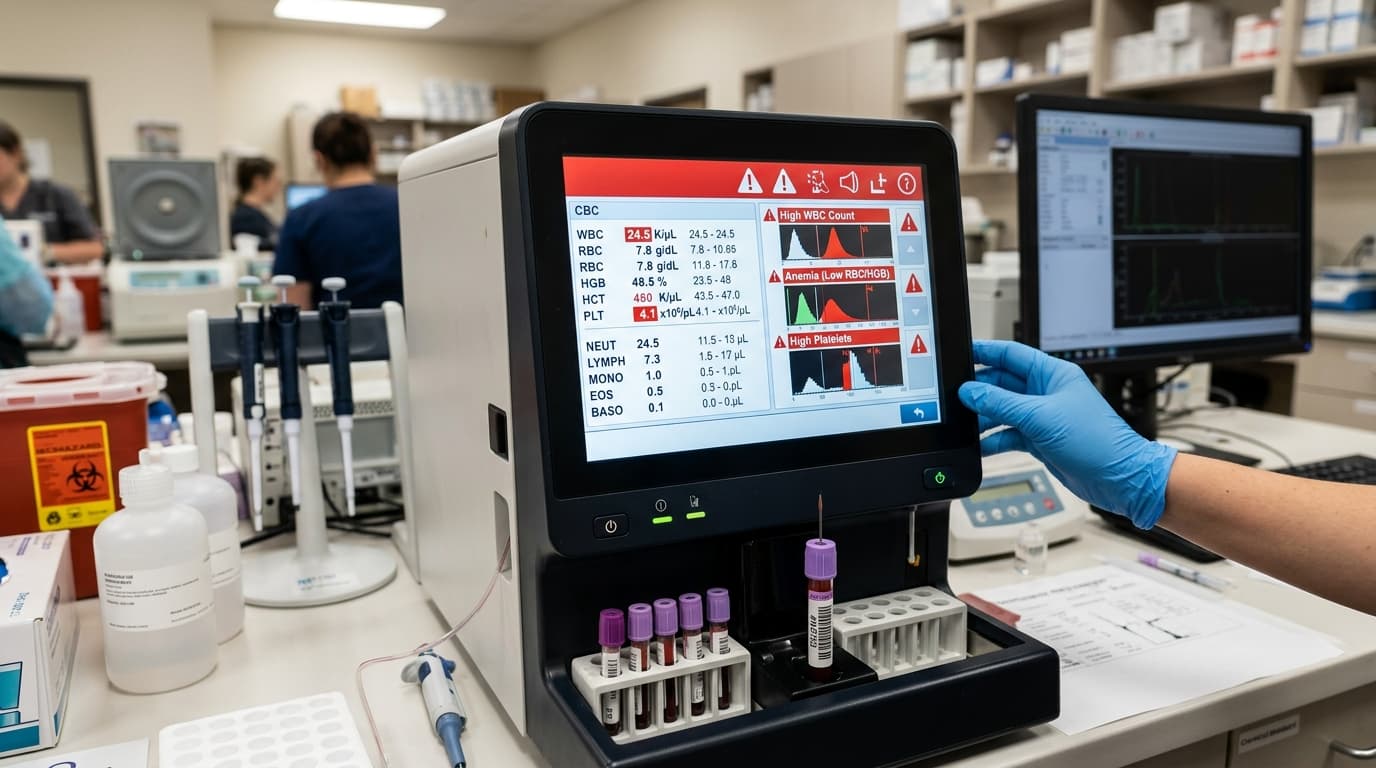
Many veterinary practices report that up to 15% of routine complete blood counts (CBCs) trigger abnormal sample flags. Handling these alerts efficiently differentiates a streamlined laboratory workflow from one bottlenecked by constant manual blood smear reviews. A high-quality hematology analyzer is designed to alert operators to cellular abnormalities—such as platelet clumping, nucleated red blood cells (NRBCs), or lipemia. However, interpreting these alerts without causing significant delays requires clinical precision and standardized protocols.
Routinely ignoring flags compromises diagnostic accuracy, while overreacting to false positives drains staff time. Establishing a structured response to abnormal sample indicators ensures precise patient diagnostics and optimized clinic operations.
Efficiency Gains: The Numbers Speak
Laboratory efficiency hinges on the accurate interpretation of diagnostic alerts. Industry guidance suggests that clinics implementing standardized flag-response protocols reduce unnecessary manual blood smear reviews by up to 40%. When an analyzer flags a sample, it is detecting events outside predetermined algorithms—such as overlapping cell volumes or abnormal cell complexities.
A structured approach to these warnings directly impacts turnaround time (TAT). Practices that train technicians to immediately recognize whether a flag requires a machine recalibration, a sample redraw, or a microscopic confirmation report an average drop of 12 minutes per abnormal case. Over a week processing 100 CBCs, this translates to recovering hours of technical labor previously lost to redundant testing and troubleshooting.
3 Settings That Cut Procedure Time
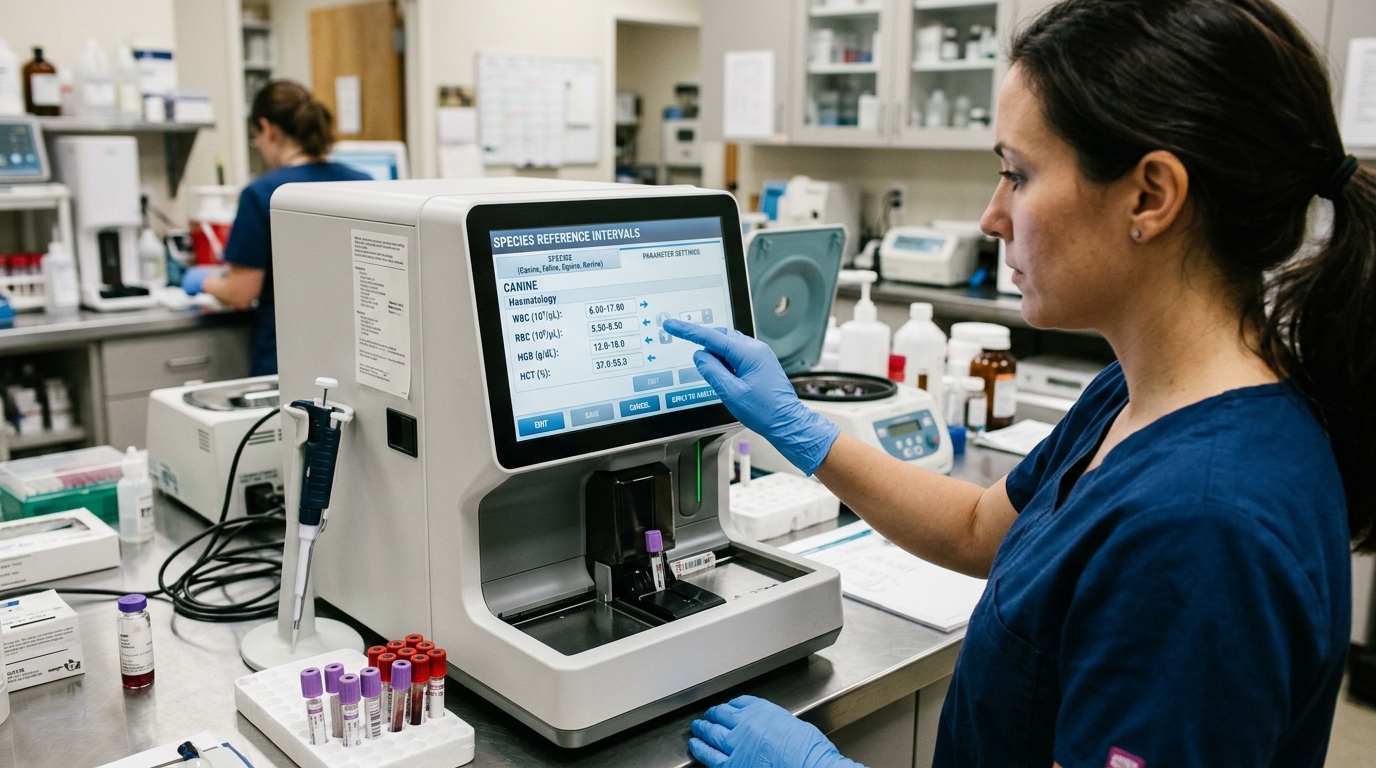
Modern equipment relies on sophisticated algorithms, but improper configuration is a primary driver of false flags. Adjusting specific baseline settings allows operators to align the equipment with actual clinical populations.
First, strict adherence to species-specific gating is critical. Feline platelets frequently overlap with red blood cell (RBC) volumes. Utilizing advanced units like the VET Hematology Analyzer HH - 8300 allows technicians to apply refined species profiles, significantly reducing feline macro-platelet interference flags. Second, clinics should establish age-adjusted reference intervals. Pediatric and geriatric patients naturally present variations in lymphocyte counts and RBC indices that may trigger warnings if evaluated against standard adult parameters.
Third, dynamic thresholding for compromised samples—such as those exhibiting moderate hemolysis or lipemia—helps the system differentiate between true cellular abnormalities and pre-analytical artifacts. Based on HQS clinical observation, practices that calibrate their feline platelet volume thresholds bi-annually reduce false thrombocytopenia flags by an average of 22%.
Error Rate: Trained vs. Untrained Staff
The discrepancy in error rates between trained operators and untrained staff is most evident during abnormal sample processing. Untrained personnel often respond to a warning flag by repeatedly running the same compromised sample, wasting expensive reagents and accelerating equipment wear.
In contrast, trained technicians evaluate the pre-analytical variables first. If a canine sample flags for NRBCs, a trained operator understands that impedance-based counting may falsely elevate the white blood cell (WBC) count, prompting an immediate manual differential rather than a machine rerun. Similarly, trained staff will visually inspect feline blood tubes for micro-clots before processing, preventing aperture blockages that trigger cascading mechanical errors.
Downtime Cost per Hour of Misuse
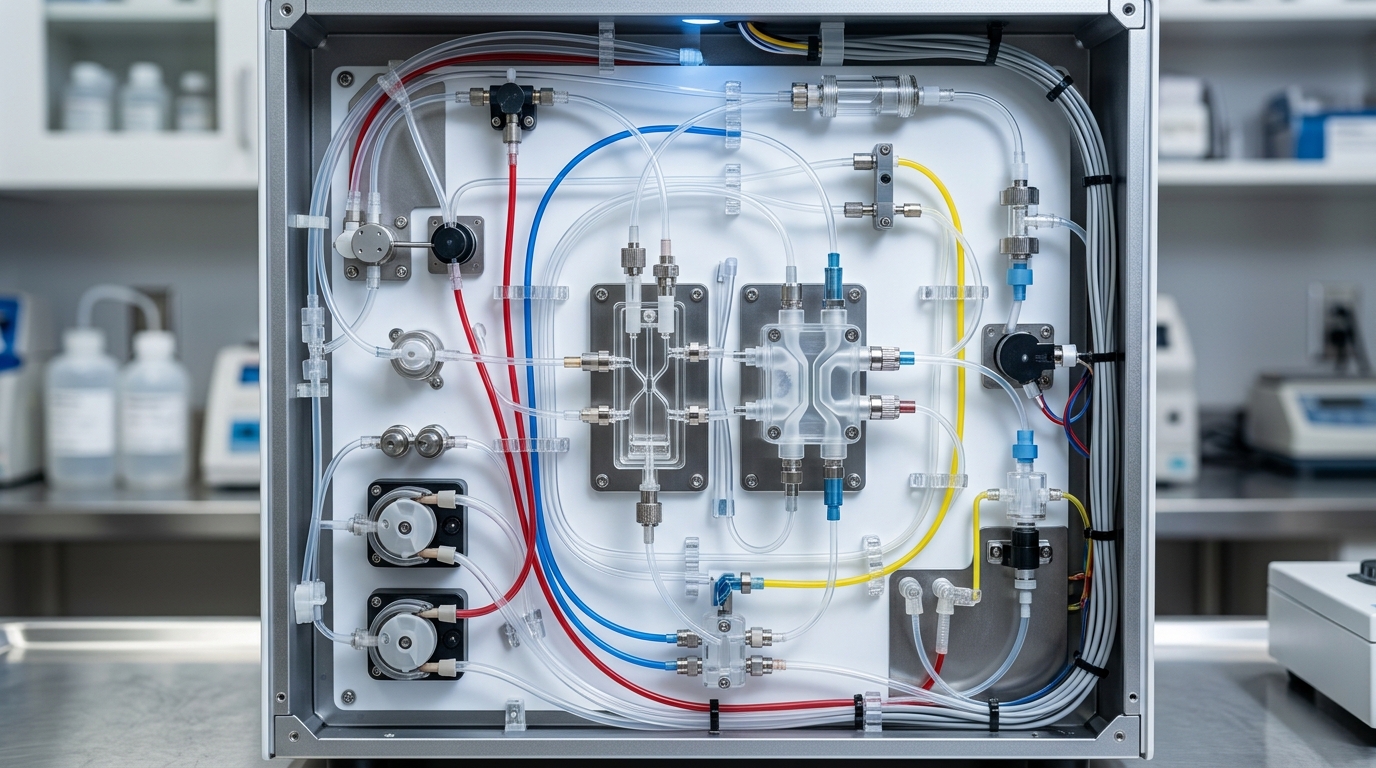
Improper handling of flagged samples often transitions from a diagnostic issue to an equipment failure issue. Processing heavily clotted or lipemic samples without proper protocol frequently leads to clogged apertures or contaminated fluidic pathways. In our manufacturing experience, analyzing the root cause of service calls reveals that a significant percentage of flow system blockages are directly linked to operator misuse following an initial sample flag.
The economic impact is measurable. An analyzer offline for maintenance delays anesthetic procedures, extends consultation times, and disrupts the billing cycle. Clinics can experience financial losses estimated between $150 and $300 per hour of laboratory downtime, factoring in delayed treatments and outsourced testing costs. Implementing rigorous sample preparation protocols—such as proper EDTA tube inversion and visual clot checks—mitigates this risk.
Maintenance Interval Benchmarks
To maintain algorithm accuracy and prevent mechanical failures that cause false flags, establishing a strict maintenance schedule is non-negotiable. Below is a comprehensive breakdown of required maintenance frequencies for veterinary hematology analyzers.
| Frequency | Task | Key Action |
|---|---|---|
| Daily | Background Check & Auto-Rinse | Process a blank cycle to ensure reagent baseline values fall within acceptable zero limits before running patient samples. |
| Weekly | Aperture & Bath Cleaning | Apply specialized enzymatic cleaner to dissolve protein buildup and prevent micro-clot blockages in the counting chambers. |
| Monthly | Tubing & Syringe Inspection | Visually assess all fluidic lines for micro-bubbles, crystalline deposits, or loose connections that disrupt vacuum pressure. |
| Annual | Sensor Calibration & PM | Engage a certified technician to calibrate optical lasers, replace worn O-rings, and validate impedance sensor accuracy. |
Data Summary: Optimization Impact
Tracking key performance indicators provides clinical managers with a clear view of how training and protocol adjustments improve laboratory throughput. The following data summary illustrates the anticipated improvements when clinics transition from reactive to proactive abnormal sample management.
| Optimization Metric | Reactive Baseline | Structured Protocol Result | Net Improvement |
|---|---|---|---|
| False Positive Flag Rate | 15% - 20% of samples | < 8% of samples | Significant reduction in manual reviews |
| Average Processing Delay | 15 minutes per flagged sample | 3 minutes per flagged sample | 12 minutes saved per case |
| Reagent Waste Cost | High (multiple reruns) | Minimal (targeted reruns only) | Lower operational overhead |
| Unplanned Downtime | 3 - 4 instances annually | < 1 instance annually | Increased clinical continuity |
Frequently Asked Questions
How do I manage a persistent platelet clump flag in feline samples?
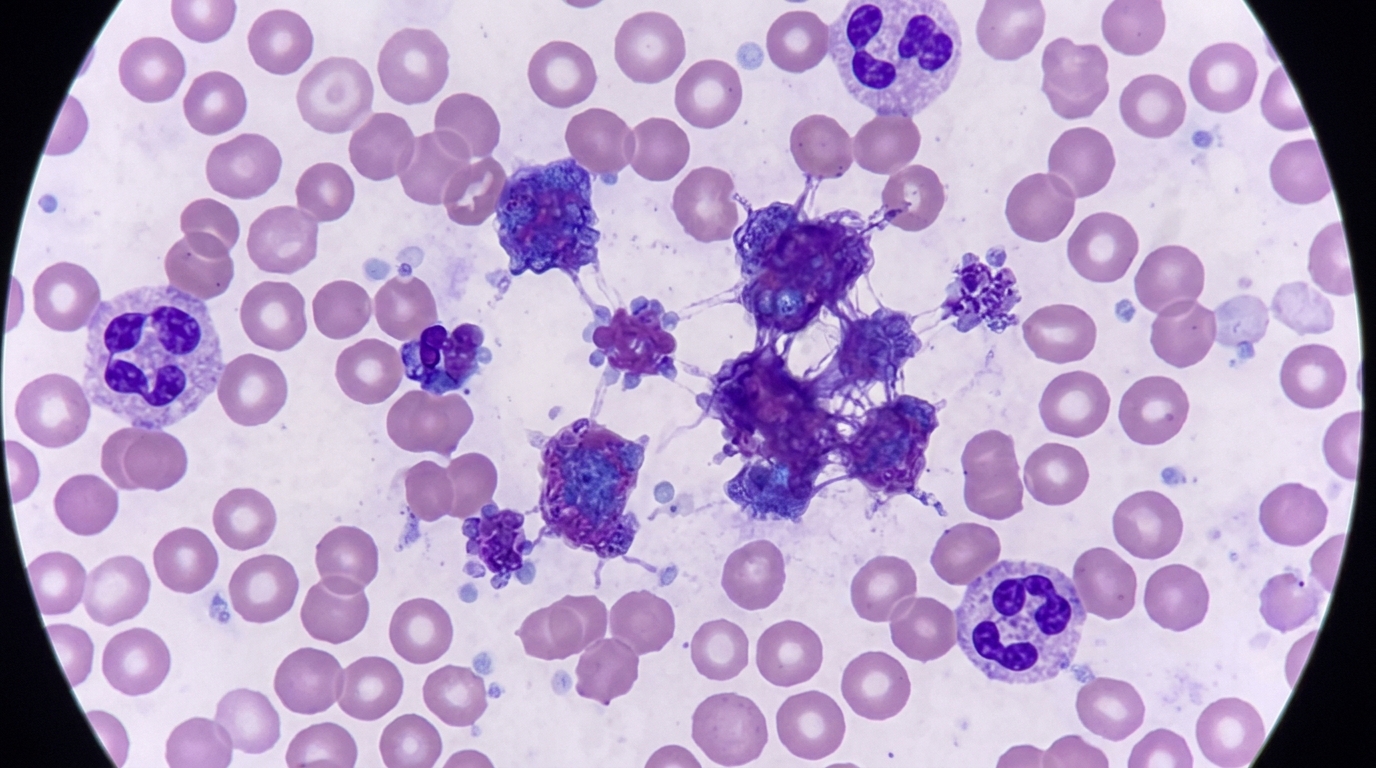
Draw blood from the medial saphenous vein to reduce tissue thromboplastin, use a clean stick, and immediately invert the EDTA tube 8 to 10 times. If the analyzer flag persists despite these measures, a manual blood smear review at the feathered edge is necessary to estimate adequate platelet numbers, as automated impedance systems cannot accurately separate large clumps.
What causes nucleated red blood cell (NRBC) interference on a vet hematology analyzer?
NRBCs share similar size and volume characteristics with lymphocytes. An analyzer relying solely on impedance technology may count these nucleated cells as white blood cells, falsely elevating the total leukocyte count. Advanced units flag this cellular overlap, alerting the technician that a manual differential is required to manually correct the true WBC count.
How does severe sample hemolysis affect the final CBC data?
Severe hemolysis involves the destruction of red blood cells before analysis, which artificially decreases the hematocrit (HCT) and overall red blood cell (RBC) count. Concurrently, the released hemoglobin falsely elevates the mean corpuscular hemoglobin concentration (MCHC). Operators should verify the sample plasma color after centrifugation; if it appears cherry red, drawing a fresh sample is highly recommended for accurate clinical data.